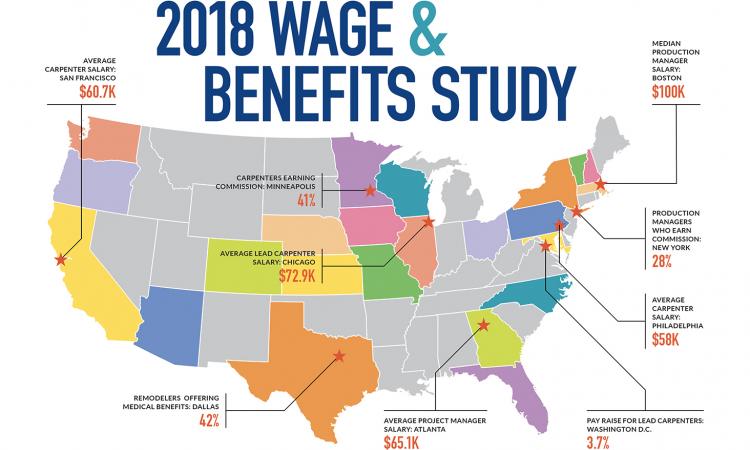

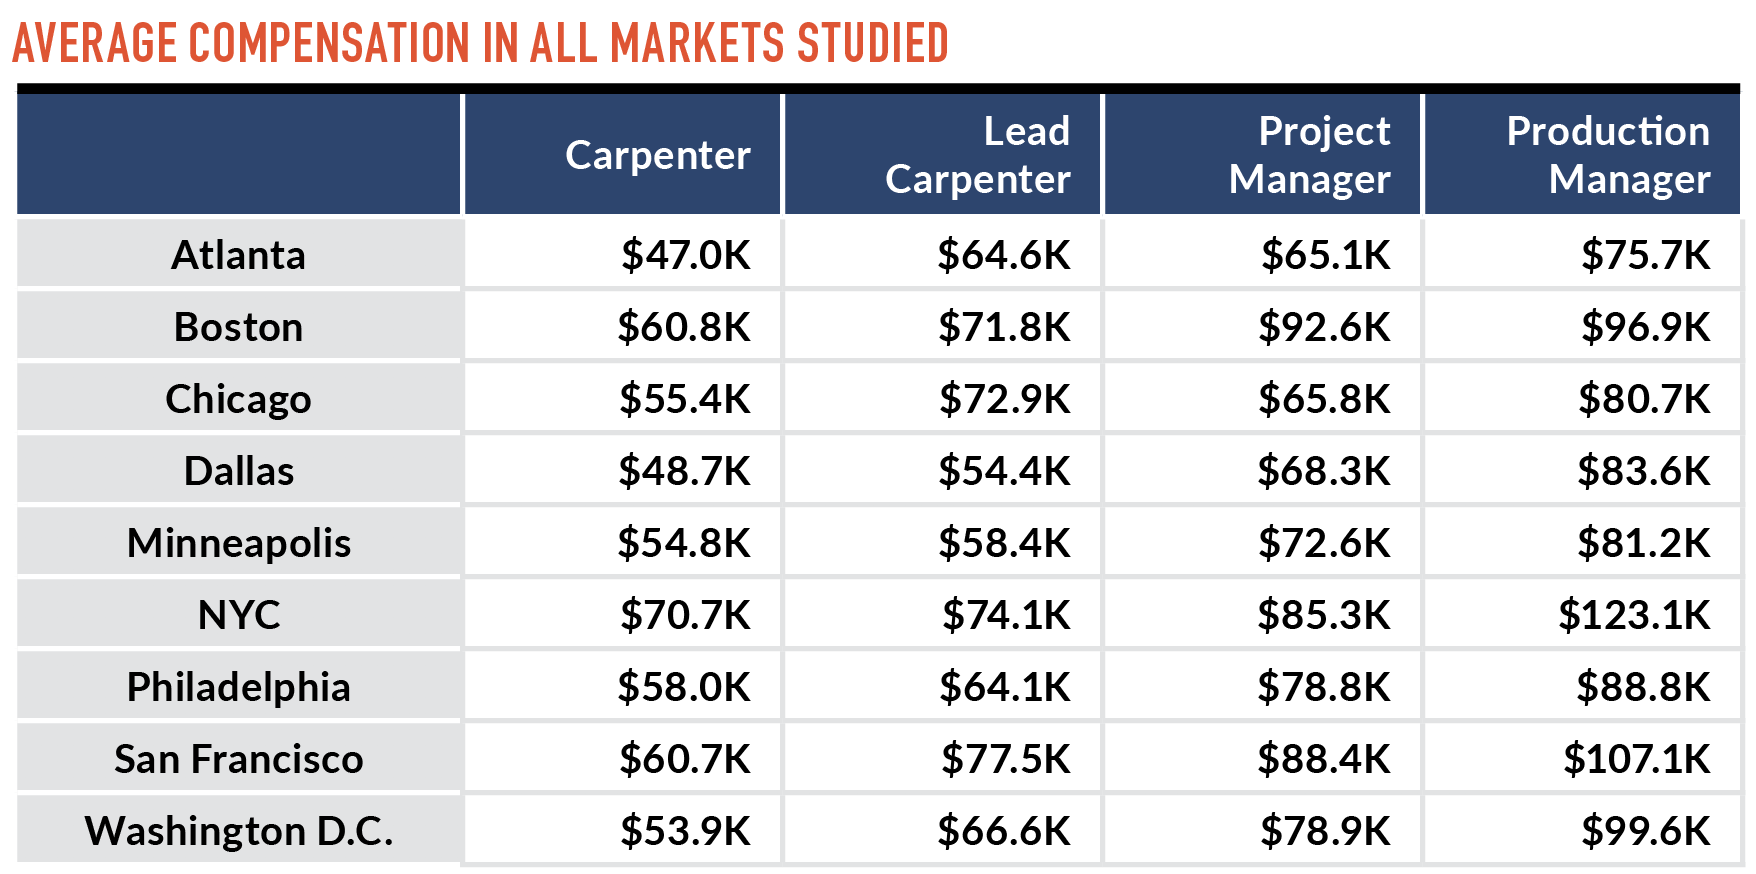
A detailed look at how much production teams are paid in different markets around the country
Welcome to Professional Remodeler’s 2018 Wage & Benefit Study, the inaugural step in what we hope will become a long tradition of bringing increased knowledge and competitiveness to the remodeling industry. There’s a lot of revealing data here, and over time we plan to align salary information with stats on the labor shortage to learn more about how the two interact.
As you can imagine, developing a project that codifies salary information from nearly 1,000 companies required thought and planning. With that in mind, before you dig into our findings, we’d like to explain the hows and whys of this study.
Why A Wage And Benefit Study?
How much should a residential remodeler in Chicago pay an entry-level carpenter? How about a production manager in San Francisco? Until now that information hasn’t been readily available.
The $330-billion remodeling industry is highly fragmented, with the vast majority of companies earning less than $3 million in revenue per year. The Bureau of Labor Statistics publishes average salaries for certain construction positions, but the data clearly pertains to larger homebuilders. For example, according to the BLS, construction managers in the Dallas-metro area earn an average of $98,740 annually. Compare that figure to our data, which shows that production managers with Dallas-based remodeling companies earn $83,600. The job descriptions are quite different as well.
A number of industry organizations have also done salary surveys, but the data is either for members only, or confined to one location. As a result, we saw a real need for this information and decided to act.
Selecting The Target Markets
We knew we didn’t want to survey the country by region. This is because a project manager in rural New England makes less than one in Boston, and it’s inaccurate to place them both on the same list, publish the average, and call it “Northeast Project Manager.” Instead, we wanted to home in on certain metro areas for greater accuracy.
To select our markets, we focused on cities with a combination of high populations, robust home sales, and strong remodeling activity. We also factored in markets that the Joint Center for Housing Studiesconsiders in its Leading Indicator of Remodeling Activity.
Unfortunately, we weren’t able to obtain enough responses for a deep dive into every market we selected. Yet even with less participation, valuable data still emerged. Those figures, along with a few bits from markets we weren’t even targeting, are displayed here.
Types Of Companies Represented
We aimed to cast the widest net possible in asking respondents to fill out the survey. Not surprisingly, we started with our subscriber base, but a number of industry groups and individuals generously lent their support to the project as well. The majority of our 903 respondents are full service remodelers with revenues of more than $1 million. A few homebuilders were included, and all of them offer remodeling as part of their business.
Developing The Survey
It’s no secret that the remodeling industry lacks standardization, especially when it comes to job descriptions and pay structures. Every business has its own way of doing things.
For that reason, we couldn’t just ask, “What do you pay your project manager?” For starters, not all PMs bear the same responsibilities, and in addition they aren’t all paid the same way—on top of salary, some earn commissions and bonuses. The same is true when you compare any job title across remodeling companies.
To solve that problem, we created a series of job descriptions, and expanded our questions from, “What do your employees make?” to: what do they make; how is the pay structured (i.e., salary, commission, bonuses); do they have a benefits package, and if so, what’s in it; and finally, how qualified are they—what experience do they have in the industry, and how long have they been with their current company?
A PROJECT MANAGER IN RURAL NEW ENGLAND MAKES LESS THAN ONE IN BOSTON, AND IT’S INACCURATE TO PLACE THEM BOTH ON THE SAME LIST, PUBLISH THE AVERAGE, AND CALL IT “NORTHEAST PROJECT MANAGER.”
Designing a relevant survey for all remodelers—regardless of how their company was structured—was a challenge. Our editorial advisory board proved especially helpful during this phase, providing on-the-ground expertise in the crafting of many survey questions.
Looking forward
If you ask most remodelers today if they are paying their employees well, more often than not they’re going to tell you “yes,” because everyone wants to believe themselves fair.
But what is fair pay? Should it be determined only by what other companies are paying, or should cost of living in a particular location be taken into account? And what is the relationship between compensation for production staff and the workforce shortage?
On the following pages, we will attempt to answer those questions along with many others. And this data will grow in the coming years as we report on changes in pay scale and connect that to the labor market overall.
Market-By-Market Results
Atlanta
Boston
Chicago
Dallas
Minneapolis
New York City
Philadelphia
San Francisco
Washington D.C.
More
—This study is reprinted from Professional Remodeler, who would like to thank the following individuals and organizations for their invaluable contributions to this project: Nathan Cross; Victoria Downing; Mina Fies; Allison Iantosca; Robi Kirsic; Elizabeth McKenna; Milwaukee Tool; Judy Mozen; the National Association of the Remodeling Industry; Mark Peterson; Remodelers Advantage; Bill Simone; Andy Wells; Steve Wheeler; Matt White; and Paul Zuch.